Plotting utilities#
Package: agabpylib.plotting
Introduction#
Classes and functions for setting plotting styles, creating colour maps, and making specific types of plots, all based on matplotlib.
Plot styles#
Detailed API: agabpylib.plotting.plotstyles
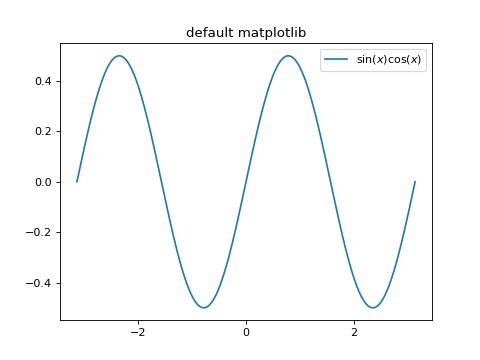
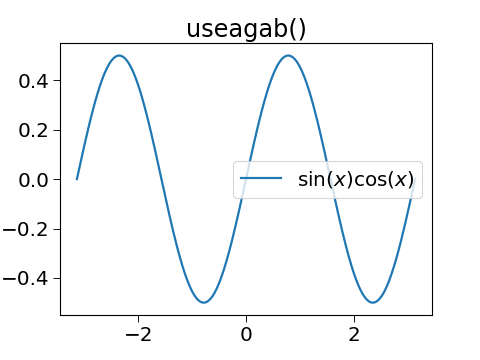
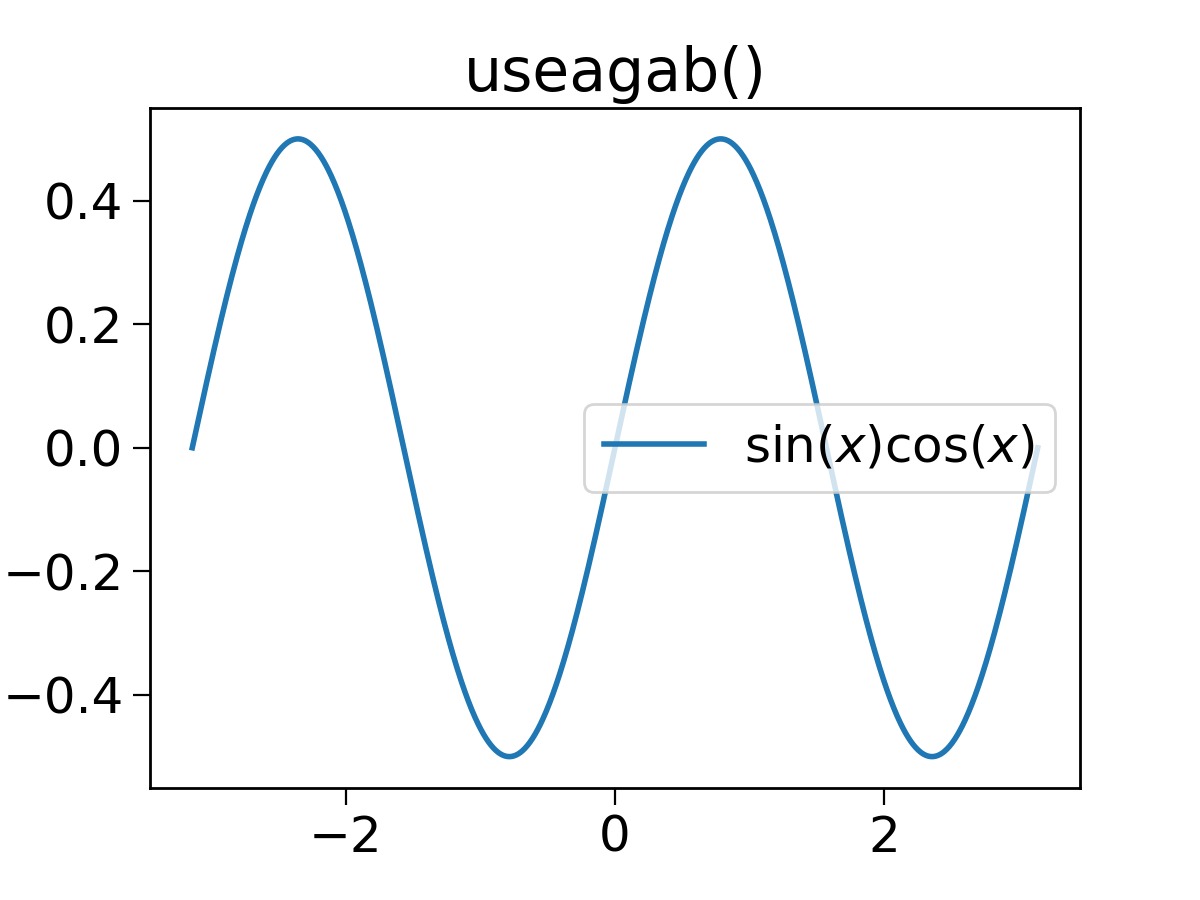
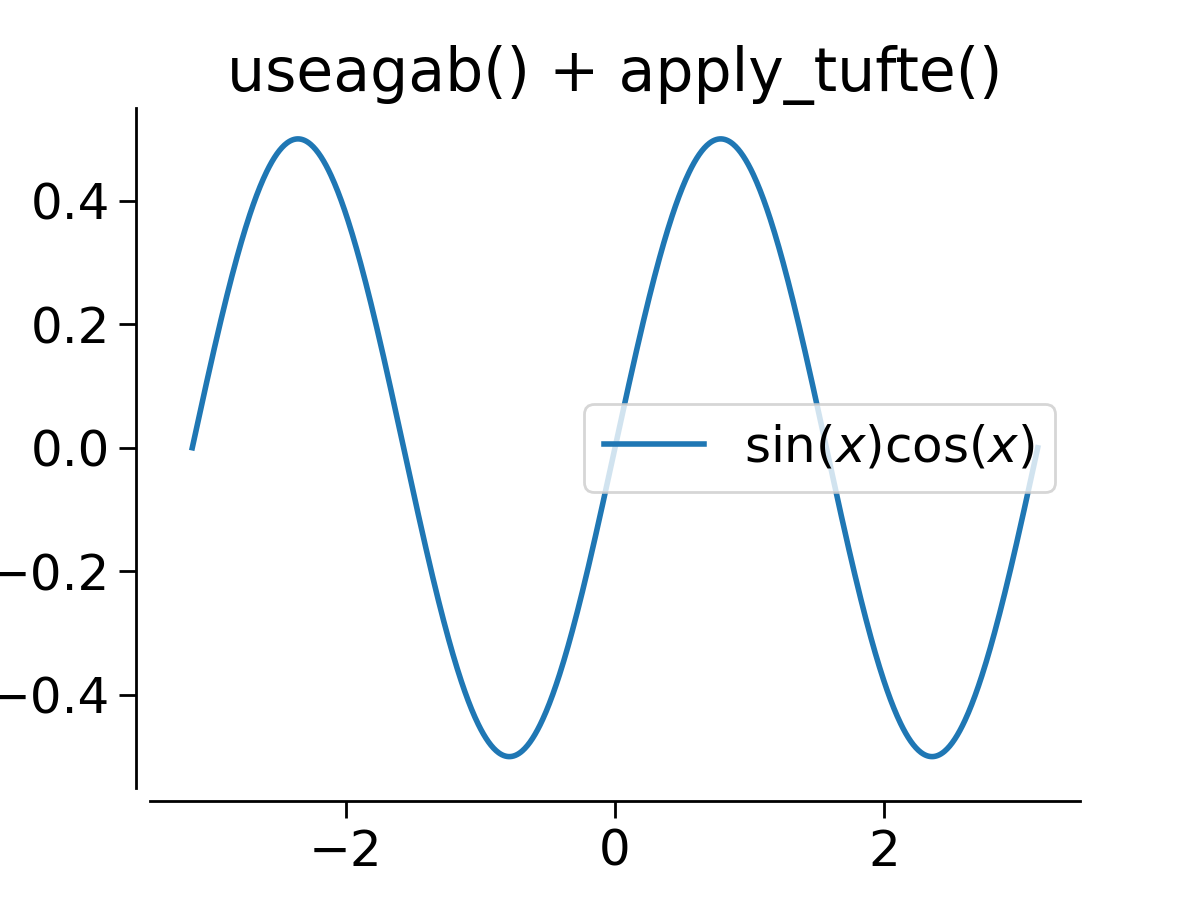
The plotting style can be set by invoking useagab which results in larger fonts, thicker lines,
specific tick lengths, and a choice for the number colours to use for the colour cycler. A colour-blind
friendly alternatice to matplotlib’s tab10 colour scheme can be used, namely an older scheme by
Paul Tol (pre-2021).
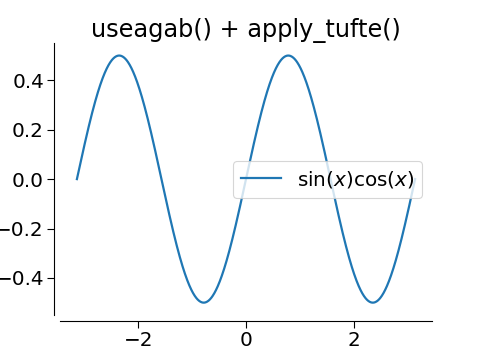
The apply_tufte function mimics the sparse style advocated by Tufte in his book
“The Visual Display of Quantitative Information”.
Example plots are include here to show the difference with the default matplotlib style.


Colour maps#
Detailed API: agabpylib.plotting.agabcolormaps
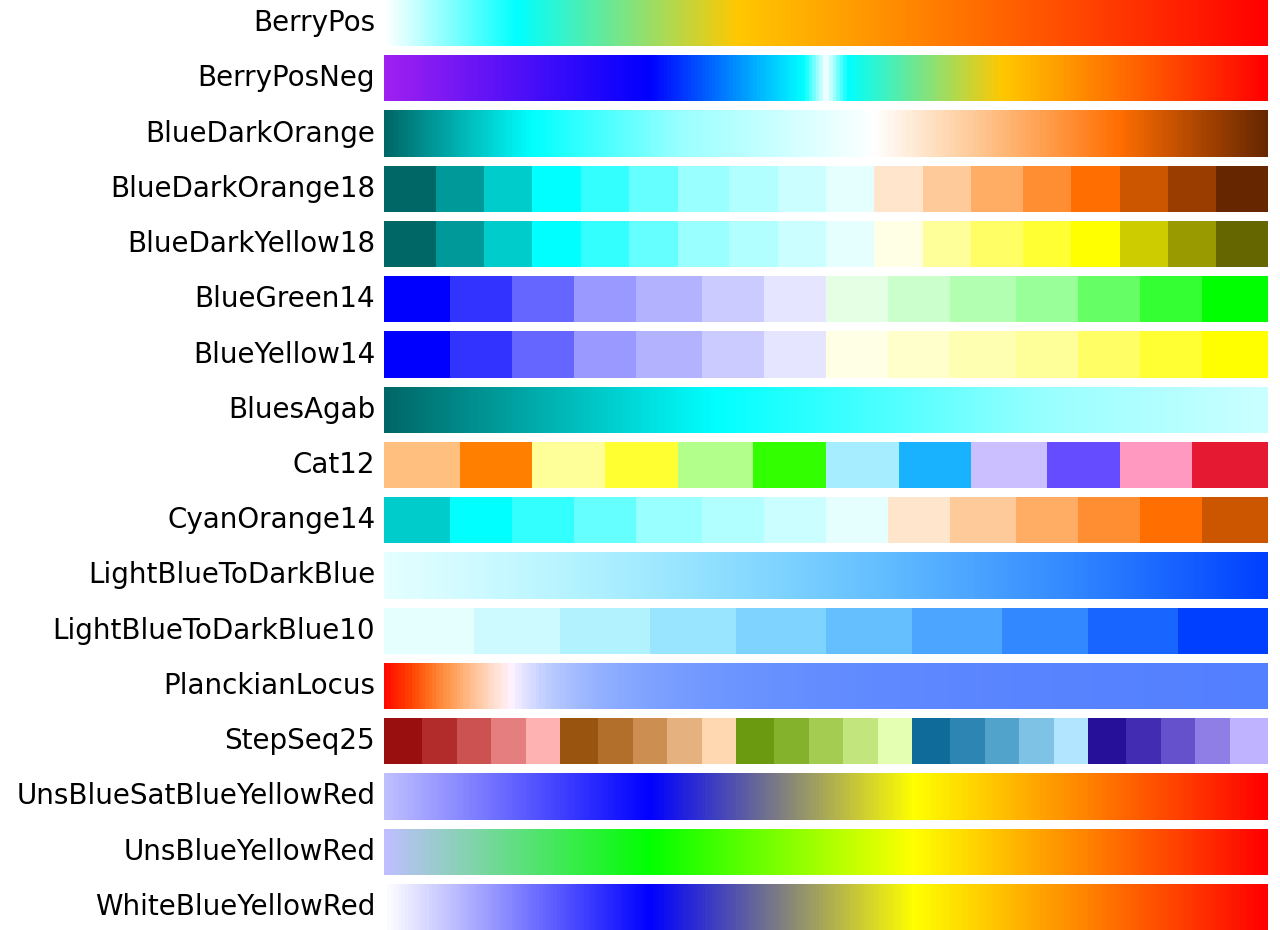
The agabpylib.plotting.agabcolormaps module adds colour maps which were collected from a variety
of sources. Most of these should not be used. The code is mostly retained for illustration of how to
create custom colour maps for use with matplotlib.
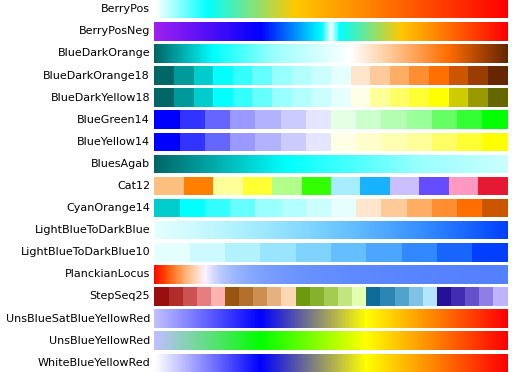
Here is a visualization of the colour maps.
(Source code, png, hires.png, pdf)
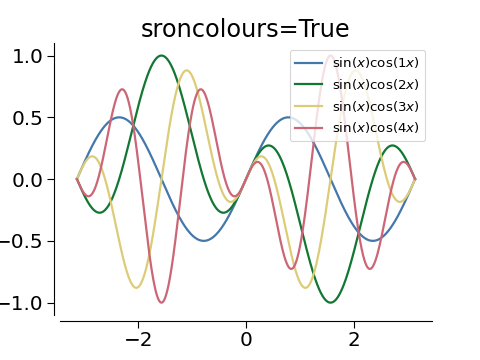
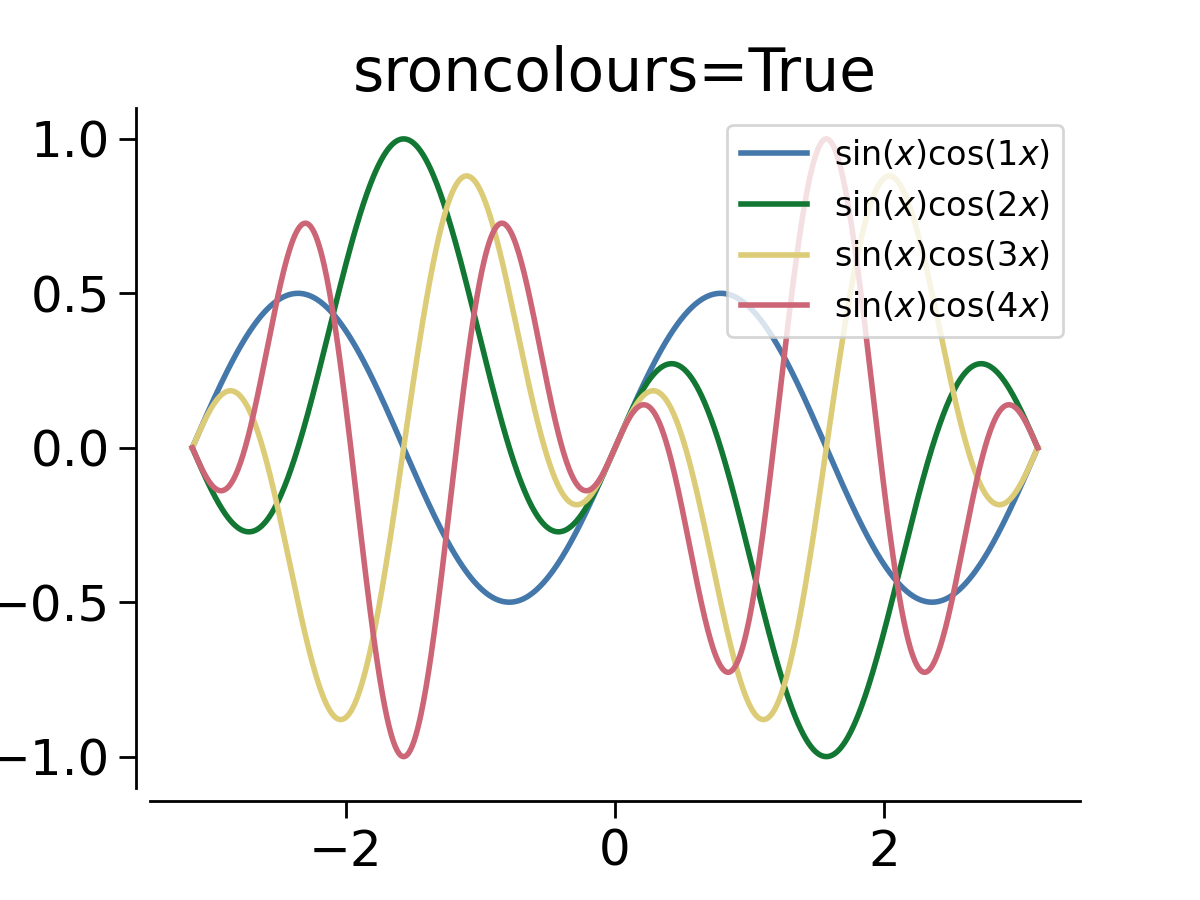
Distinct colour-blind friendly colours#
Detailed API: agabpylib.plotting.distinct_colours
The useagab() style offers the option to use the colour set developed by Paul Tol (SRON). The colour
set is from the 2011 code by Tol, and corresponds to the 2021 “muted” colour set (see https://personal.sron.nl/~pault/).
Plots of distributions#
Detailed API: agabpylib.plotting.distributions
The module agabpylib.plotting.distributions provides functions for making plots of 1D or 2D distributions
of data, such as samples from an MCMC run. This module is obsolete as the functionality is covered much better
by other packages such as, for example, corner or
arViz.
Plotting tools for inference#
Detailed API: agabpylib.plotting.inference
The module agabpylib.plotting.inference provides functions that are useful when making plots in the
context of inference problems.